8.3.3 Process Automation and Tool Alignment/Integration
Performance management cannot depend on manual processes and activities in a vCloud. Given its dynamic nature, effective management of vCloud performance requires tooling and instrumentation to be in place. Manual processes and traditional performance tools that focus primarily on up or down status cannot provide the required level of performance data.
For effective performance management, you must understand the impact of metric coverage. Having instrumentation at all levels of the application stack enables much better insight into the overall performance of an application. This is particularly true with end-user experience monitoring, which provides information to administrators about the consumer experience. Traditionally, administrators have relied on component level monitoring to approximate a service’s availability or performance. This approach provides only partial results and rarely identifies actual performance problems.
To solve this problem, an analytics tool is needed to analyze more than just the up or down status of traditional monitoring tools. An analytics tool enables an administrator to see the relative performance of a system based on dynamically generated baselines. By using VMware vCenter Operations Manager (part of the VMware vCenter Operation Management Suite), this level of detail in vCloud implementations is understood and can be instrumental in revealing more complex performance management issues.
8.3.3.1. Event Management
A key feature of vCenter Operations Manager is the ability to establish dynamic baselines on millions of metrics within an organization’s environment. These baselines also take into account time of day, day of week, and other cyclical patterns to understand normal behavior. The baselines are then used to determine early warning smart alerts if too many metrics start behaving abnormally at the same time. If KPIs or Super Metrics have been defined to capture known problem areas, KPI smart alerts that have associated automated or interactive workflows can be triggered.
Figure 22. vCenter Operations Manager Event Management Within the Custom UI
8.3.3.2. Incident Management
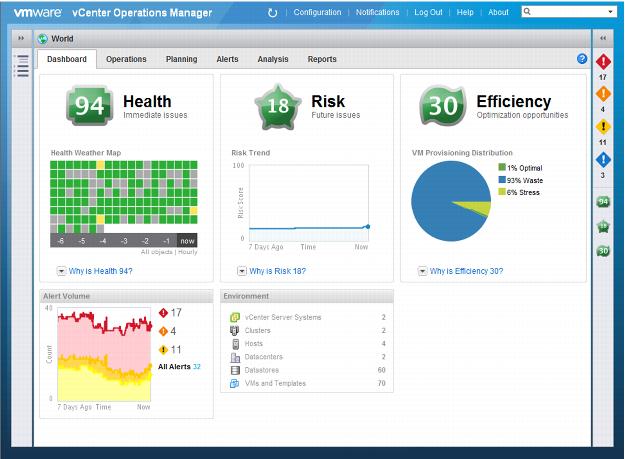
After a performance incident is identified, an administrator can use vCenter Operations Manager to locate the responsible underlying system. The Health badge can provide insight into performance management incidents, as shown in the following figure.
Figure 23. vCenter Operations Manager Performance Management in the vSphere UI
The vCenter Operations Manager analytics capability analyzes the current and past usage patterns of resources in a vCloud environment and provides users with both a high-level and a detailed view of the health of their environment.
8.3.3.3. Problem Management
After an incident is resolved, an administrator can use vCenter Operations Manager to identify the responsible system and the root cause of the issue. Examining the underlying system that was responsible for a performance issue can expose the relationship to other tiers within an application, any smart alerts that are associated with it, and the performance history of affected components. This process can help identify the root cause of the issue.