8.1.9 Management Cluster
The Management c
luster has several different components that must
be monitored for
continued operation of the c
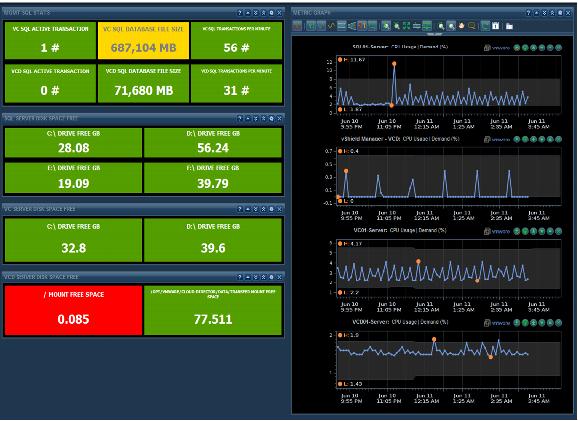
loud. A sample Management Dashboard is shown in Figure 72. The example monitors the following
cloud management components:  SQL Server (vCenter/vCloud Director
 databases).
vCenter Server.
vCloud Director cell.
vCenter Operations Manager.
Chargeback.
vCloud Networking and Security
Manager.
Figure 72. Management Cluster Dashboard
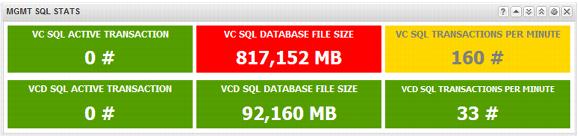
The first widget is used to monitor the SQL database for database size and transactions metrics. The Hyperic agent is used to collect these metrics and display them in a scoreboard widget.
The following metrics are used for this widget:
Metric used:
Microsoft SQL Server 2008 (database
SQL01-Server MSSQLSERVER).
Databases:
VCD and vCenter
(the
SQL databases).
Metric | Unit | Green Range | Yellow Range | Orange Range | Red Range |
vCenter SQL Active Transactions | # | 100 | 100–200 | 200–300 | 300 |
vCenter SQL Database File Size | MB | 60000-70000 | 70000–80000 | 80000–90000 | 900000 |
vCenter SQL Transactions per Minute | # | 100 | 100–200 | 200–300 | 300 |
VCD SQL Active Transactions | # | 100 | 100–200 | 200–300 | 300 |
VCD SQL Database File Size | MB | 10000 | 10000–20000 | 20000–30000 | 30000 |
VCD SQL Transactions per Minute | # | 100 | 100–200 | 200–300 | 300 |
Note: These threshold/ranges are only examples. These values should be based on the cluster design threshold values and the customer requirements.
The completed widget appears as follows:
Figure 73. Completed Widget
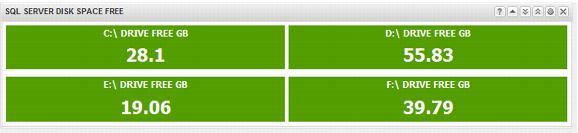
The following widget monitors the SQL Server free space on each logical operating system drive. This example uses the following drive letters:
C:\
Operating system driv.D:\
SQL database files.
E:\
SQL log files.
F:\
SQL backup.
This example monitors free space available on each of these drives and configures alerts based on thresholds. The metric used is part for the resource kind Virtual Machine and data is collected using VMware Tools. This example uses the Scoreboard widget as follows.
Metric | Unit | Green Range | Yellow Range | Orange Range | Red Range |
Guest File System C:\ Guest File System Free | GB | 15 | 10–15 | 8–10 | 8 |
Guest File System D:\ Guest File System Free | GB | 15 | 10–15 | 8–10 | 8 |
Guest File System E:\ Guest File System Free | GB | 15 | 10–15 | 8–10 | 8 |
Guest File System F:\ Guest File System Free | GB | 15 | 10–15 | 8–10 | 8 |
Note: These threshold/ranges are only examples. These values should be based on the cluster design threshold values and the customer requirements.
The completed widget appears as follows:
Figure 74. Completed Widget xxxxx
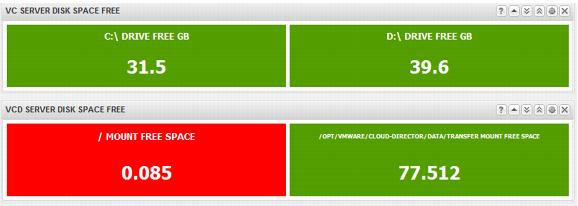
The same metric can be used to create a widget that monitors the vCenter and vCloud Director cells for free space. Monitor the transfer folder free space of the vCloud Director cells. Using a Scoreboard widget you can create a widget as shown in the following illustrations. Note that the transfer folder mount point is monitored. The default mount point is /opt/vmware/cloud-director/data/transfer in the Linux operating system (vCloud Director cell).
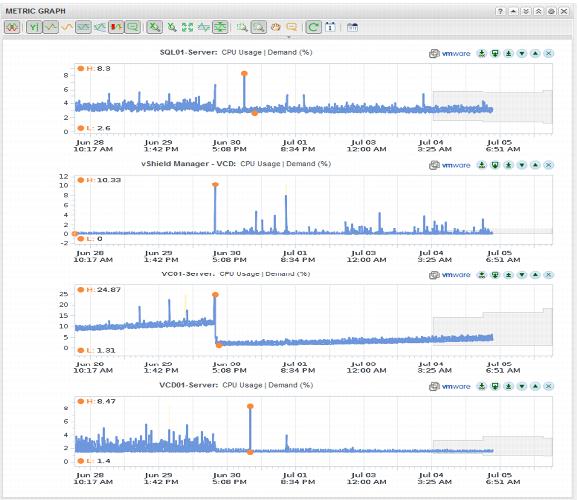
You can use a Metric Graph widget to monitor for historical CPU demand on the following infrastructure objects:
SQL Server
vCloud Networking and Security
ManagervCloud Director cells
vCenter Server
The following metrics are used to create the widget.
Resource | Metric |
SQL Server | CPU Usage | Demand (%) |
vCloud Networking and Security Manager | CPU Usage | Demand (%) |
vCenter Server | CPU Usage | Demand (%) |
vCloud Director Cell | CPU Usage | Demand (%) |
The completed widget displays as follows: