8.1.8 Capacity Remaining
Capacity remaining in a cluster is useful in determining available capacity for future virtual machine deployments. Public service providers provide the illusion of infinite capacity so they must be able to proactively add capacity as needed on demand. As an example, this information can be used to gauge how many more virtual machines can be deployed on a resource cluster based on the observed average workload profile in the environment. This example looks at the time left before running out of storage, network, and compute resources in a cluster.
T
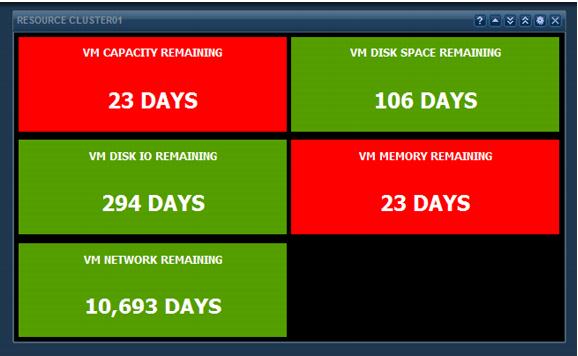
he Scoreboard widget shown in Figure 71 is used to display information about available time (d
ays) left in the c
luster for CPU, memory, disk, and network.
This example uses the Capacity Remaining metric. The Green threshold is high, and the Red threshold is low. The metric resource selections used in the widget are as follows:
Metric | Unit | Green Range | Yellow Range | Orange Range | Red Range |
Count | VM | Days | 90 | 60–90 | 30–60 | 30 |
Count | VM | Disk Space | Days | 90 | 60–90 | 30–60 | 30 |
Count | VM | Disk I/O | Days | 90 | 60–90 | 30–60 | 30 |
Count | VM | Memory | Days | 90 | 60–90 | 30–60 | 30 |
Count | VM | Network | Days | 90 | 60–90 | 30–60 | 30 |
Note: These threshold/ranges are only examples. These values should be based on the cluster design threshold values and the customer requirements.
Figure 71. Capacity Remaining Scoreboard Dashboard