8.1.5.6. Storage Dashboard
The Storage
Dashboard widget
can help with
troubleshooting at the cluster or host level
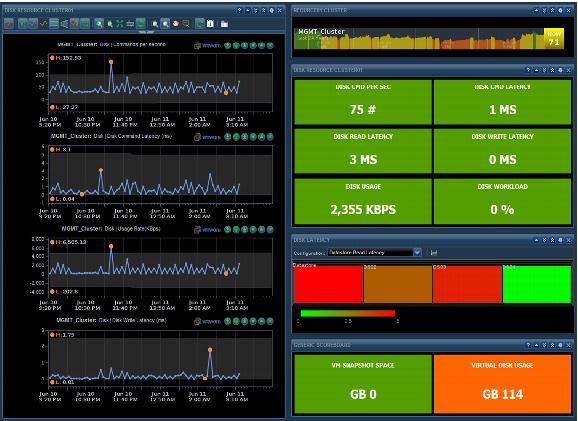
and can be used by the virtual infrastructure admins and the storage administrators. Figure 58 shows this dashboard which is made using four widgets:  Cluster Storage
 Metric Graph (
Figure 61).
This dashboard focuses on cluster statistics and datastore hot spots. Hot spots in this example are related to latency to the datastore as detected by the ESXi host. Heat maps can also be used to identify datastores with low capacity remaining, which is done using a super metric.
Figure 58. Storage Dashboard
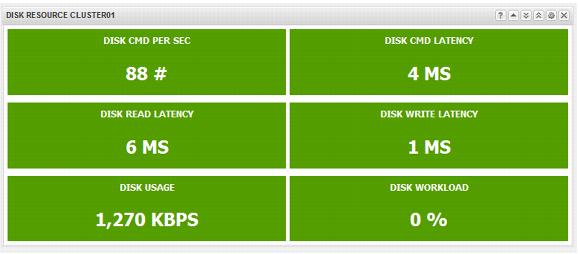
This dashboard uses two Scoreboard widgets. The first widget displays statistics related to the cluster I/O usage. The second widget displays information about virtual memory snapshot space and virtual disk usage.
Table 19. Cluster Storage Usage Widget Settings
Metric | Unit | Green Range | Yellow Range | Orange Range | Red Range |
Disk CMD Per Sec | # | 200 | 200–300 | 300–400 | 400 |
Disk CMD Latency | ms | 20 | 20–30 | 30–40 | 40 |
Disk Read Latency | ms | 20 | 20–30 | 30–40 | 40 |
Disk Write Latency | ms | 20 | 20–30 | 30–40 | 40 |
Disk Usage | KBps | 10000 | 1000–2000 | 2000–3000 | 3000 |
Disk Workload | % | 50 | 50–60 | 60–70 | 70 |
Note: These threshold/ranges are only examples. These values should be based on the cluster design threshold values and the customer requirements.
Figure 59. Cluster Disk Scoreboard Widget
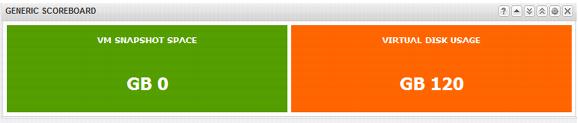
The second generic scoreboard widget displays virtual machine disk space information. This example shows how much snapshot space is used and the total amount of virtual disk space used.
Table 20. Cluster Disk Capacity Scoreboard Settings
Metric | Unit | Green Range | Yellow Range | Orange Range | Red Range |
Virtual Machine Snapshot Space | GB | 1 | 1–10 | 10–20 | 20 |
Virtual Disk Usage | GB | 90 | 90–200 | 200–500 | 500 |
Note: These threshold/ranges are only examples. These values should be based on the cluster design threshold values and the customer requirements.
Figure 60. Cluster Disk Capacity Scoreboard Widget
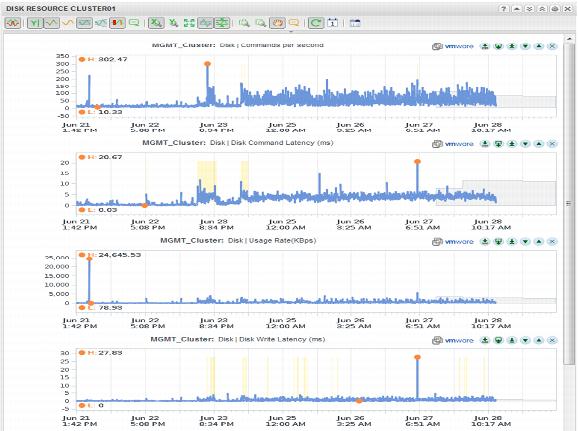
The Metric Graph widget displays historical disk statistics that include the DT values. The DT values are also displayed for the next number of hours, depending on the Date Control selection). In Figure xxx, we have enabled the Anomalies view also (all the yellow spikes). For the example we are displaying historical stats for the following metrics:
Metric | Unit |
Disk | Commands per second |
Disk | Disk commands latency (ms) |
Disk | Usage rate (KBps) |
Disk | Disk write latency (ms) |
Disk | I/O usage capacity |
Figure 61. Cluster Storage Metric Graph Widget