8.1.5.2. Generic Scoreboard
The widget configuration settings are shown in the following table.
Setting | Value |
Widget Title | Displayed title of widget |
Self Provider | On |
Refresh Widget Content | On |
Widget Refresh Interval | 300 (seconds) |
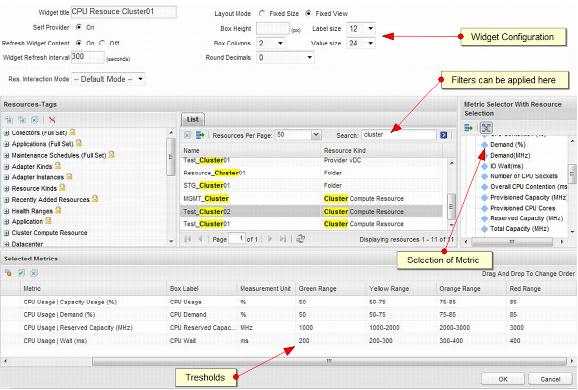
After the widget settings have been set, the relevant objects and metrics must be selected. This example uses a filter for cluster. Then the cluster for which we want to display statistics, and metrics, are selected. After all the desired metrics are listed in Selected Metrics, the thresholds can be configured.
The following table shows the thresholds that can be set.
Threshold | Range |
Green | Up to 10 |
Yellow | 10–20 |
Orange | 20–30 |
Red | 30 and higher |
The following figure shows the completed widget.
Figure 47. Generic Cluster CPU Scoreboard